
Back in late 2024, a prospective homebuyer in Tampa, Florida walked away from a 1,400-square-foot cottage listed at $350,000 ($250 per sq ft), choosing instead a sprawling 2,800-square-foot home nearby listed at $504,000 ($180 per sq ft). On paper, the larger home seemed like a steal—a full $70 per square foot cheaper. But three months after closing, the buyer faced $65,000 in roof and HVAC replacements, while living on a cramped lot adjacent to a noisy commercial alley. Meanwhile, the smaller cottage featured a completely upgraded gourmet kitchen, original restored hardwood, and sat on an acre lot in a high-demand school zone. Price per square foot had hidden the truth.
Price per square foot is the most widely cited statistic in real estate listings, but blindly trusting it is one of the quickest ways to misjudge property value. In this article, we unpack exactly when price per square foot serves as a reliable comparison metric, when it breaks down, and how top real estate professionals evaluate properties accurately.
What Is Price Per Square Foot?
A Quick Definition
Price per square foot is a standard mathematical metric that expresses the purchase price or listing price of a property relative to its total livable area in square feet. It gives buyers and sellers a single baseline unit cost for quick initial screening.
How Price Per Square Foot Is Calculated
Calculating price per square foot requires dividing the total price by the total finished square footage. For example, a $450,000 home with 2,250 square feet of finished living space equals $200 per square foot. To test your own figures in seconds, use our interactive price per square foot calculator, or read our step-by-step tutorial on how to calculate price per square foot.
Why Buyers and Sellers Use This Metric
Real estate agents, investors, and buyers use this calculation because it simplifies complex properties into an easy digestible number. It offers a fast way to filter out obviously overpriced listings across large online search portals before scheduling in-person tours.
Is Price Per Square Foot a Reliable Way to Compare Properties?
The Short Answer
The short answer is: Yes, but only under highly specific conditions. Price per square foot is a starting point for analysis, not a final verdict. Treating it as an absolute measurement of value without examining surrounding context leads to major financial missteps.
When It Works Well
The metric delivers excellent accuracy when comparing cookie-cutter suburban homes built by the same developer in the same neighborhood around the same year. When square footage, construction quality, lot size, and floor plans are virtually identical, price per square foot accurately highlights seller pricing strategy differences.
When It Doesn't
Price per square foot fails whenever properties vary significantly in age, renovation level, lot size, architectural layout, or micro-location. A square foot of living space in a dark basement or hallway does not carry the same market value as a square foot in a sunlit master suite with luxury finishes.
Price Per Square Foot Reliability Gauge
Visual MatrixWhen Price Per Square Foot Is a Good Comparison Tool
Comparing Similar Homes
If you are choosing between two 3-bedroom, 2-bathroom tract homes of 1,800 sq ft built in 2018 with comparable builder-grade finishes, price per square foot provides an immediate, trustworthy comparison of market value.
Comparing Homes in the Same Neighborhood
Within a single subdivision where school districts, tax rates, HOA rules, and municipal services are constant, per-square-foot figures establish clear pricing boundaries for typical properties on that specific street.
Comparing Similar Property Types
Comparing condo to condo in the same high-rise building, or single-family ranch to single-family ranch, keeps structural variables consistent. To understand deeper property valuation nuances, explore our detailed analysis on factors that determine price per square foot.
Comparing Recently Sold Properties
When analyzing sales that closed within the past 60 to 90 days, price per square foot offers a sharp snapshot of current buyer demand before market sentiment shifts.
When Price Per Square Foot Can Be Misleading
Different Home Sizes
Smaller homes inherently command a higher price per square foot than larger homes in the same area. A 1,000-square-foot starter home requires a kitchen and bathrooms—the two most expensive rooms to build—spreading high fixed construction costs over fewer total square feet.
Different Lot Sizes
Price per square foot evaluates the building, completely ignoring the land underneath it. A 2,000-square-foot home on a 2-acre wooded lot will sell for far more overall than an identical home on a 0.15-acre lot, artificially inflating the per-square-foot figure of the larger parcel.
Different Floor Plans
An open-concept, modern layout with vaulted ceilings feels spacious and usable, whereas an older home with cut-up rooms, wide dark hallways, and poorly placed load-bearing walls loses practical efficiency despite having identical square footage.
Different Property Conditions
A turnkey home featuring a newly replaced roof, updated electrical wiring, and high-efficiency HVAC justifies a much higher per-square-foot price than a fixer-upper with deferred maintenance requiring $80,000 in immediate repairs.
Luxury Features and Upgrades
Quartz countertops, custom cabinetry, wolf ranges, and white oak flooring push property value upward without adding a single square foot of space, drastically raising the price per square foot comparison metric.
Location Differences
Even within a single zipcode, homes backing up to a quiet nature preserve sell at a massive premium compared to homes situated directly against a noisy four-lane arterial road.

Common Mistakes People Make When Comparing Properties
Comparing Different Property Types
Comparing a single-family home's price per square foot to a downtown condo is a frequent error. Condos include shared amenities and maintenance fees in their structure, distorting pure square footage math.
Ignoring Property Age
A home built in 1960 and one built in 2024 have vastly different structural lifespans, insulation performance, and building code standards that per-square-foot metrics fail to capture.
Ignoring Renovations
Unrenovated homes look like bargains on a square-foot basis until renovation costs are factored in. Always add estimated remodel expenses to the purchase price before comparing.
Focusing Only on Price Per Square Foot
Relying exclusively on a single mathematical ratio blinds buyers to emotional appeal, natural light, layout flow, neighborhood safety, and long-term resale potential. Review our comprehensive guide on square footage for real estate buyers and sellers to learn balanced evaluation methods.
Using Outdated Market Data
In fluctuating interest rate environments, sales comps older than 3 to 6 months distort current valuation benchmarks.
Factors You Should Compare Alongside Price Per Square Foot
Micro-Location: Cul-de-sac placement, street noise, school ratings, and walking distance to parks.
Property Condition: Age of roof, HVAC systems, plumbing, foundation integrity, and water drainage.
Lot Size & Usability: Total acreage, slope, privacy, trees, and flood zone status.
Functional Layout: Bedroom/bathroom count, closet space, ceiling heights, and natural lighting.
Residential vs. Commercial Property Comparisons
Residential Real Estate
Residential comparisons focus on Gross Living Area (GLA)—above-grade finished spaces measured from exterior walls per ANSI Z765 standards.
Commercial Real Estate
Commercial properties calculate price per square foot using Rentable Square Footage (RSF), incorporating a load factor for common lobbies, corridors, and shared elevators.
Investment Properties
Real estate investors prioritize Net Operating Income (NOI), Capitalization Rate (Cap Rate), and Cash-on-Cash Return over raw price-per-square-foot ratios.
Real-World Comparison Examples
Example 1: Two Similar Homes
Two 2,000 sq ft homes in suburban Austin, TX: Home A is listed at $440,000 ($220/sq ft) and Home B at $420,000 ($210/sq ft). Both are 2015 builds in pristine shape. Here, Home B represents genuine savings of $20,000.
Example 2: Small Home vs. Large Home
A 1,200 sq ft house at $360,000 ($300/sq ft) versus a 3,200 sq ft house at $768,000 ($240/sq ft). The higher $/sq ft on the smaller house is a normal economic function of fixed infrastructure costs spread over fewer square feet.
Example 3: Renovated vs. Unrenovated Property
Home X (renovated) costs $500,000 ($250/sq ft for 2,000 sq ft). Home Y (1970s original) costs $400,000 ($200/sq ft). Renovating Home Y to match Home X costs $130,000. Home X is actually the better deal overall.
Example 4: Different Neighborhoods
A 2,000 sq ft home in District A costs $600,000 ($300/sq ft), while the same home in District B costs $400,000 ($200/sq ft). District A's top-rated schools and 10-minute commute justify the per-square-foot premium.
Real-World Comparison Breakdown
Case StudyWhat Professional Appraisers Consider Beyond Price Per Square Foot
Comparable Sales (Comps)
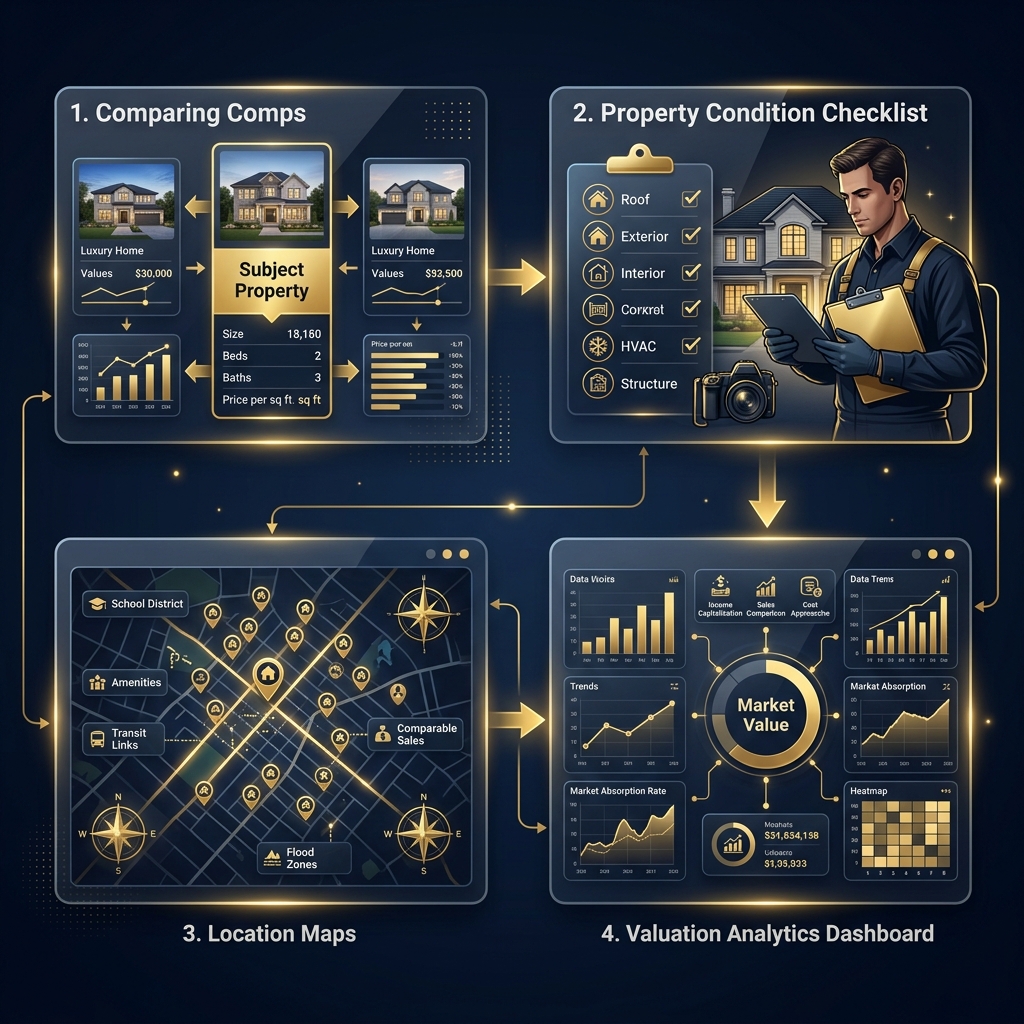
Appraisers select 3 to 6 recent, verified sales within close proximity, analyzing precise feature-by-feature differences rather than relying on blanket per-square-foot averages.
Property Condition
Appraisers assign condition ratings (C1 new construction down to C6 severe structural defects) which mandate specific dollar adjustments regardless of square footage.
Location Adjustments
Appraisers apply line-item adjustments for site attributes including mountain views, busy street exposure, power lines, and commercial abutments.
Market Conditions
Time adjustments (time-of-sale trending) account for inflation, interest rate movements, and seasonal demand swings across comparable sale dates.
Unique Property Features
In-ground pools, detached workshops, solar arrays, and ADUs (accessory dwelling units) receive dedicated line-item valuations outside the standard square footage calculation.
Better Ways to Compare Property Value
Comparable Sales Analysis
The gold standard method used by licensed appraisers: taking comparable properties and adding or subtracting exact dollar amounts for specific feature differences.
Price-to-Value Ratio
Evaluating total acquisition cost against immediate equity, replacement costs, and local rental income yield.
Market Value Estimates
Combining Automated Valuation Models (AVMs) with localized real estate agent Broker Price Opinions (BPOs).
Professional Property Appraisals
Hiring a licensed independent appraiser who physically inspects the property structure and verifies finished gross living area per ANSI standards.
Investment Return Metrics
For investors, using Cap Rate, Gross Rent Multiplier (GRM), and Cash-on-Cash Return provides superior clarity. Check our room size calculation tools like the house square footage calculator for precise space planning.
Should Buyers, Sellers, and Investors Use Price Per Square Foot?
For Home Buyers
Use it as a quick initial screening filter to flag outlier listings, but never base your final offer price solely on per-square-foot figures.
For Home Sellers
Use local per-square-foot averages to establish a realistic pricing benchmark, then adjust your asking price up or down based on your home's unique upgrades and condition.
For Real Estate Investors
Use it to evaluate renovation potential (cost to purchase + cost to remodel per sq ft vs. expected after-repair value per sq ft).
Pros and Cons of Using Price Per Square Foot
• Standardized metric across listings
• Helps spot grossly overpriced homes
• Easy to calculate and understand
• Ignores renovation quality and age
• Skews dramatically between home sizes
• Treats useless space same as luxury space
When It Should Be Your Primary Metric
Only when evaluating near-identical suburban tracts or uniform condo units in the same building.
When It Should Only Be a Secondary Metric
In all historic neighborhoods, custom homes, rural properties, mixed-use areas, and homes with major size or lot discrepancies.
Best Practices for Comparing Properties Accurately
Compare Like with Like: Only compare homes of similar architectural style, age, and size bracket.
Use Recent Data: Focus strictly on sales closed within the last 90 days.
Verify Square Footage: Confirm livable square footage via county tax records or professional appraisals, excluding unfinished basements and garages.
Leverage Calculators: Verify all per-square-foot ratios using our online price per square foot calculator before making financial commitments.
Final Verdict: Is Price Per Square Foot Enough?
When You Can Trust It
You can trust price per square foot when comparing highly similar homes in homogeneous neighborhoods as a quick preliminary filter.
When You Should Look Beyond It
You must look beyond it whenever evaluating properties with differences in lot size, renovation quality, floor plan usability, micro-location, or structural condition.
Key Takeaways for Buyers, Sellers, and Investors
Price per square foot is a helpful real estate compass, but it is not the destination. By combining this metric with localized comp adjustments, professional appraisals, and thorough property inspections, you ensure smarter decisions and protect your equity.
Frequently Asked Questions
Price per square foot is a fast baseline metric, but it is only reliable when comparing highly similar homes within the same neighborhood. Ratios skew when comparing homes of vastly different sizes, lot areas, or renovation conditions.
It treats all square feet equally. A square foot in a luxury kitchen costs significantly more to build and finish than a square foot in a hallway or bedroom, yet the metric averages everything together.
Yes. Factors like lot placement (corner vs interior), modern kitchen upgrades, structural condition, view premiums, and school district boundaries can create per-square-foot price gaps of $30 to $80 or more between physically identical floor plans.
No. Relying solely on price per square foot can lead to overpaying for poorly maintained space or passing up great deals on renovated homes. Always evaluate location, layout efficiency, lot size, and appraiser comps alongside the metric.
A formal Comparable Sales (Comps) analysis—which makes itemized monetary adjustments for lot size, age, upgrades, and layout—provides a far more accurate valuation than raw price-per-square-foot comparisons.
Agents select 3 to 6 recent sales within a 0.5-mile radius, adjust for feature differences (bathrooms, garage, pool, condition), analyze price per square foot as a sanity check, and review current neighborhood inventory levels.
Yes, but commercial real estate evaluates annual lease rate per square foot (often based on rentable area with load factors) rather than pure residential sale price per gross living area.
It is a helpful initial screening tool, but real estate investors prioritize Cap Rate, Net Operating Income (NOI), Cash-on-Cash return, and rent-to-price ratios over simple per-square-foot numbers.
Compare neighborhood school scores, property age, major mechanical systems (HVAC, roof), lot size and topography, layout usability, and upcoming local infrastructure developments.
Appraisers measure Gross Living Area (GLA) using ANSI Z765 standards, perform a direct sales comparison approach with line-item dollar adjustments, inspect property condition, and verify market demand trends.