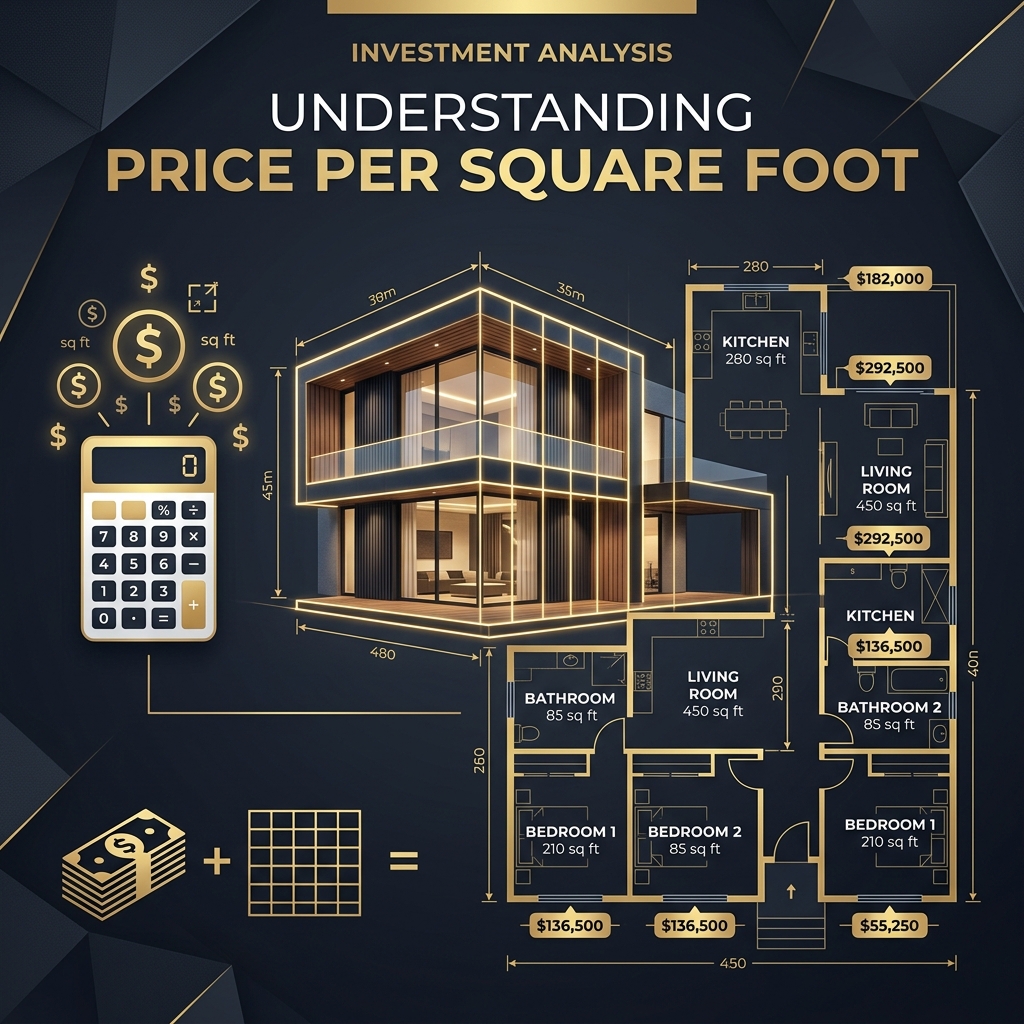
Two years ago, a first-time buyer in Austin, Texas almost paid $48,000 over market value for a 1,600 square foot bungalow. The listing price looked reasonable at $380,000, but comparable homes in the same zip code were selling between $195 and $210 per square foot. At 1,600 square feet, the fair range was $312,000 to $336,000. The listing worked out to $237 per square foot, roughly 15 percent above the neighborhood ceiling. One simple division would have revealed the gap before the buyer ever scheduled a showing. Price per square foot is the fastest way to separate a fair deal from an overpriced listing.
Whether you are buying a home, leasing office space, investing in rental property, or evaluating a vacant lot, price per square foot gives you a consistent metric for comparison. This guide walks through the formula, breaks down each variable, and applies the calculation to five different property types with real numbers. If you want an instant answer right now, the price per square foot calculator on this site handles the math in seconds.
What Does Price Per Square Foot Mean?
Price per square foot is a standard real estate metric that reduces any property's value to a single, comparable number. It tells you how much each square foot of space costs relative to the total price. Investors, appraisers, and buyers rely on this metric to evaluate whether a property is priced fairly, overvalued, or a potential bargain.
Price Per Square Foot Definition
Price per square foot is the total price of a property divided by its total area in square feet. A $350,000 home with 1,750 square feet costs $200 per square foot. A $500,000 commercial building with 5,000 square feet costs $100 per square foot. The result lets you compare properties of different sizes on equal footing. Without this calculation, a $600,000 home looks twice as expensive as a $300,000 home, but if the first one has 4,000 square feet and the second has 1,200, the larger home is actually the better value at $150 versus $250 per square foot. The square footage for real estate guide on this site explains why accurate measurement is the foundation of every pricing decision.
Why Price Per Square Foot Matters
Real estate agents, appraisers, and mortgage lenders all use price per square foot as a primary evaluation tool. Appraisers select three to six comparable sales in your area and adjust values based on per-square-foot differences. If a comp sold for $210 per square foot and the subject property has 100 fewer square feet, the appraiser deducts approximately $21,000 from that comp's value. Lenders will not approve a mortgage that exceeds the appraised value. A single pricing mistake at the square-foot level can collapse a deal. For buyers, this metric strips away the emotional pull of staging and photography. For sellers, it grounds their asking price in market reality.
When Is Price Per Square Foot Used?
You use price per square foot when comparing homes in the same neighborhood, evaluating commercial lease rates, setting rental prices, appraising property value, and analyzing land purchases. It applies to nearly every real estate transaction. The one exception is raw land in rural areas, where per-acre pricing is more common. Even then, converting to per-square-foot helps when comparing smaller parcels. Any time you need to compare two or more properties of different sizes, price per square foot is your most efficient tool.
Price Per Square Foot Formula
Formula Explained
The math is straightforward. Take the total price and divide by the total area. A $400,000 property with 2,000 square feet gives you $200 per square foot. A $1,200,000 commercial space with 8,000 square feet gives you $150 per square foot. The formula works regardless of property type, location, or market conditions. What changes is the context in which you interpret the result.
Understanding Each Variable
Property Price
The property price is the total purchase price, sale price, or listing price of the property. For a home purchase, use the agreed-upon sale price, not the asking price. For commercial leases, use the annual lease rate. For rental properties, use the monthly rent. The key is consistency. If you are comparing five homes, use the same type of price (all listing prices or all final sale prices) for each one.
Total Square Footage
Total square footage is the total finished, livable area of the property measured in square feet. For residential properties, this means the gross living area (GLA) measured from exterior walls under ANSI Z765 standards. It includes bedrooms, kitchens, bathrooms, hallways, and closets. It excludes garages, unfinished basements, patios, and decks. For commercial properties, use the rentable square footage, which includes a load factor for common areas. For land, use the lot size in square feet. The square footage calculator helps you measure any space accurately.
Price Per Square Foot
The result tells you what each square foot of the property costs. This number is meaningful only when compared against similar properties in the same area and market. A result of $200 per square foot means nothing in isolation. Compared to a neighborhood average of $185, it suggests the property is priced 8 percent above typical. Compared to an average of $230, it looks like a potential deal.
Price Per Square Foot Formula Breakdown
InteractiveHow to Calculate Price Per Square Foot
The calculation takes three steps. Each one matters because small input errors become large pricing mistakes when multiplied across hundreds or thousands of square feet.
Step 1: Find the Property Price
Start with the actual transaction price or current listing price. For existing properties, pull the sale price from county records, MLS data, or Zillow. For new construction, use the builder's total contract price. Avoid using estimated values or tax assessment values, which lag behind real market prices by 12 to 24 months in most jurisdictions. If you are comparing multiple listings, decide upfront whether you will use asking prices or final sale prices, and stick with that choice for every property in your comparison.
Step 2: Measure the Total Square Footage
Get the total square footage from the listing, the appraisal, or your own measurements. For residential properties, the MLS listing usually shows the gross living area. Cross-check this number against the county tax records and, if possible, the most recent appraisal. If the numbers disagree by more than 5 percent, investigate further. For commercial properties, request the rentable square footage from the landlord. For raw land, convert the acreage to square feet by multiplying by 43,560.
Step 3: Divide the Price by the Area
Divide the total price by the total square footage. A $425,000 home with 2,125 square feet equals $200 per square foot. A 3,500 square foot commercial space leased at $87,500 per year equals $25 per square foot per year. Round to two decimal places for precision when comparing close values. This single number now lets you compare the subject property against every other property in your analysis.
Step-by-Step Calculation Process
VisualVerify Your Results with a Price Per Square Foot Calculator
After running the calculation manually, verify your result with the price per square foot calculator on this site. Manual calculations are prone to data entry errors, especially when you are comparing five or more properties at once. A calculator eliminates arithmetic mistakes and lets you adjust variables instantly to see how changes in price or area affect the per-square-foot result.
Real Examples of Price Per Square Foot Calculations
Theory is useful, but real numbers drive real decisions. Here are five calculations across different property types, each using actual market ranges from mid-2026.
Example 1: Residential Home
A 2,200 square foot three-bedroom home in suburban Phoenix, Arizona sells for $440,000. Divide $440,000 by 2,200 to get $200 per square foot. The Maricopa County median for similar homes ranges from $190 to $220 per square foot in mid-2026. This home falls squarely in the middle, suggesting a fair market price. If the same home were listed at $528,000, the result would be $240 per square foot, which is 9 percent above the local ceiling and signals potential overpricing.
Example 2: Apartment or Condo
A 950 square foot two-bedroom condo in Denver, Colorado lists for $332,500. Divide $332,500 by 950 to get $350 per square foot. Denver condos in desirable neighborhoods averaged $320 to $380 per square foot in early 2026. This listing falls within range. Condo pricing typically runs 10 to 30 percent higher per square foot than single-family homes in the same market because of shared amenities, location convenience, and lower maintenance requirements.
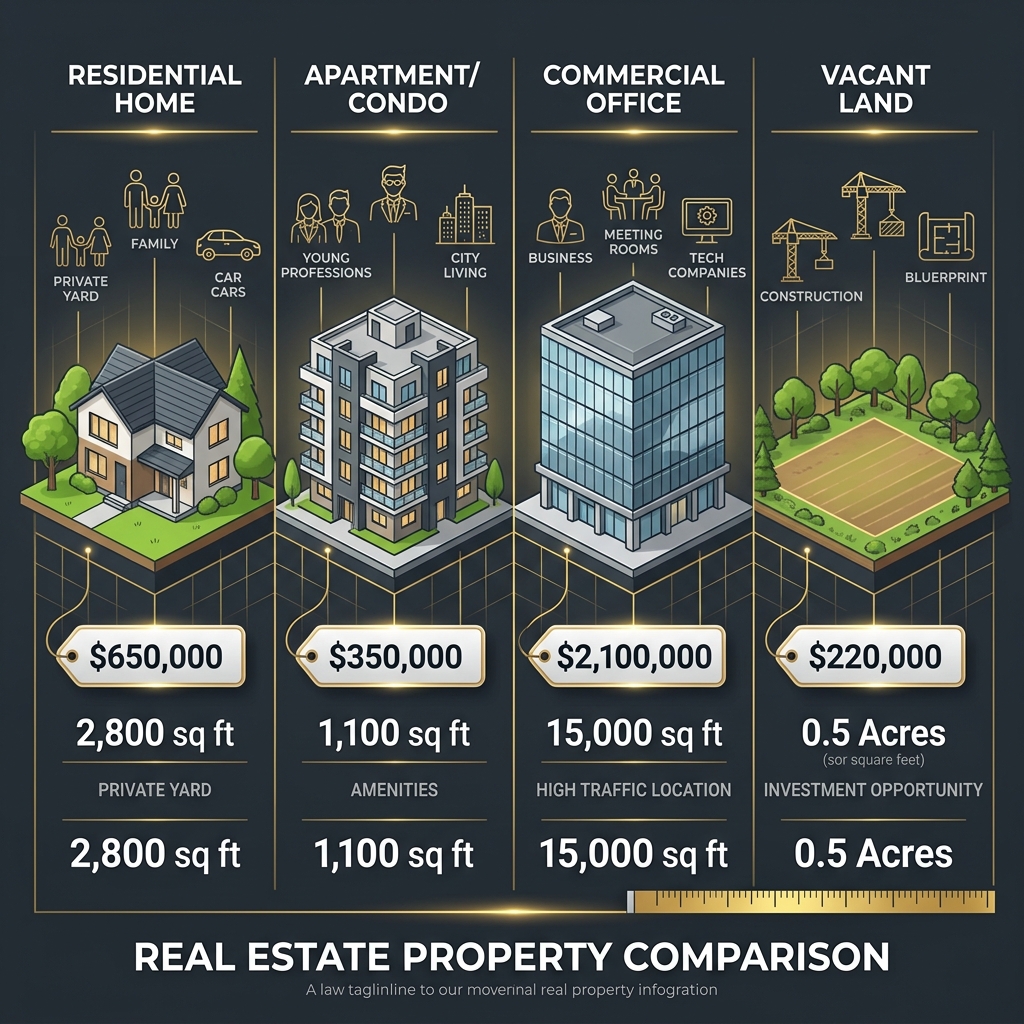
Example 3: Commercial Property
A 5,000 square foot retail space in Nashville, Tennessee leases for $125,000 per year. Divide $125,000 by 5,000 to get $25 per square foot per year. Nashville retail lease rates averaged $22 to $32 per square foot in 2026, depending on the corridor. This rate sits in the lower-middle range, making it competitive for a tenant while still delivering reasonable returns for the landlord.
Example 4: Vacant Land
A half-acre lot (21,780 square feet) in a developing neighborhood outside Charlotte, North Carolina sells for $130,000. Divide $130,000 by 21,780 to get $5.97 per square foot. Comparable lots in the same area sold between $5 and $8 per square foot during the same period. This price falls on the lower end, which could indicate strong value or could reflect limitations like difficult terrain, lack of sewer access, or easement restrictions. Always investigate the details behind the number.
Example 5: Rental Property
A 1,400 square foot three-bedroom rental unit in Indianapolis, Indiana rents for $1,680 per month. Divide $1,680 by 1,400 to get $1.20 per square foot per month, or $14.40 per square foot per year. Indianapolis rental rates for comparable units averaged $1.10 to $1.35 per square foot per month in mid-2026. This rental falls right in the middle of the market, suggesting the landlord is pricing competitively.
Price Per Square Foot Comparison by Property Type
VisualHow to Calculate Price Per Square Foot for Different Property Types
The formula stays the same, but the inputs change depending on the property type. Each type uses a different definition of "square footage" and a different type of "price."
Residential Properties
Use the sale price or listing price divided by the gross living area (GLA). GLA includes all above-grade, finished, heated living space measured from exterior walls. Exclude garages, unfinished basements, patios, and screened porches. Residential price per square foot in the United States ranges from under $100 in rural areas to over $1,500 in Manhattan. The house square footage calculator helps you verify residential measurements room by room.
Commercial Properties
For purchases, divide the sale price by the total building square footage. For leases, divide the annual lease rate by the rentable square footage. Commercial properties use BOMA standards, which include a "load factor" that distributes common areas across tenant spaces. A tenant with 2,000 usable square feet might pay rent on 2,300 rentable square feet. The load factor typically ranges from 10 to 20 percent. Always clarify whether a quote uses usable or rentable area before calculating.
Rental Properties
Divide the monthly rent by the unit's total square footage for a per-square-foot monthly rate. Multiply by 12 for an annual rate. Landlords use this metric to price units consistently across different sizes within the same building. A 700 square foot studio at $1.50 per square foot rents for $1,050 per month. A 1,100 square foot two-bedroom at the same rate rents for $1,650. The per-square-foot rate keeps pricing proportional to the space provided.
Land or Lots
Divide the lot price by the total square footage. One acre equals 43,560 square feet. A one-acre lot selling for $200,000 costs $4.59 per square foot. Land pricing is highly sensitive to zoning, utility access, topography, and proximity to development. Two adjacent lots with identical acreage can have wildly different per-square-foot prices if one is zoned commercial and the other is zoned agricultural.
How to Calculate Average Price Per Square Foot
Comparing Multiple Properties
Calculating the average price per square foot across multiple properties gives you a market benchmark. Start by selecting five to ten comparable properties that share similar characteristics: same neighborhood, similar age, similar condition, and similar size range. Calculate the price per square foot for each individual property. Then take the average of those results.
Calculating the Average Price
Average Price Per Square Foot Calculator
InteractiveAdd the price per square foot for each property and divide by the number of properties. If three comparable homes show $200, $208, and $200 per square foot, the average is $202.67 per square foot. This baseline tells you whether a new listing falls above or below the local market norm. Keep in mind that averages can be skewed by outliers. If one property sold at a distressed price or an estate sale, it could drag the average down misleadingly. Remove obvious outliers before calculating.
Common Mistakes When Calculating Price Per Square Foot
I have reviewed hundreds of property valuations across residential and commercial transactions. These five mistakes appear repeatedly, and every one of them leads to real financial losses.
Using Incorrect Square Footage
The most common mistake is using square footage numbers from tax records without verifying them. Tax records can be off by 5 to 15 percent. A home recorded at 2,200 square feet that actually measures 1,950 changes the price per square foot from $182 to $205 on a $400,000 property. That 12 percent error leads directly to a mispriced offer. Always verify the square footage against the most recent appraisal or measurement.
Comparing Different Property Types
Comparing a single-family home's price per square foot against a condo's price per square foot produces meaningless results. Condos typically cost more per square foot due to shared amenities, location premiums, and lower maintenance burdens. Comparing across property types is like comparing the price per pound of steak to the price per pound of rice. The metric works only when applied to similar items.
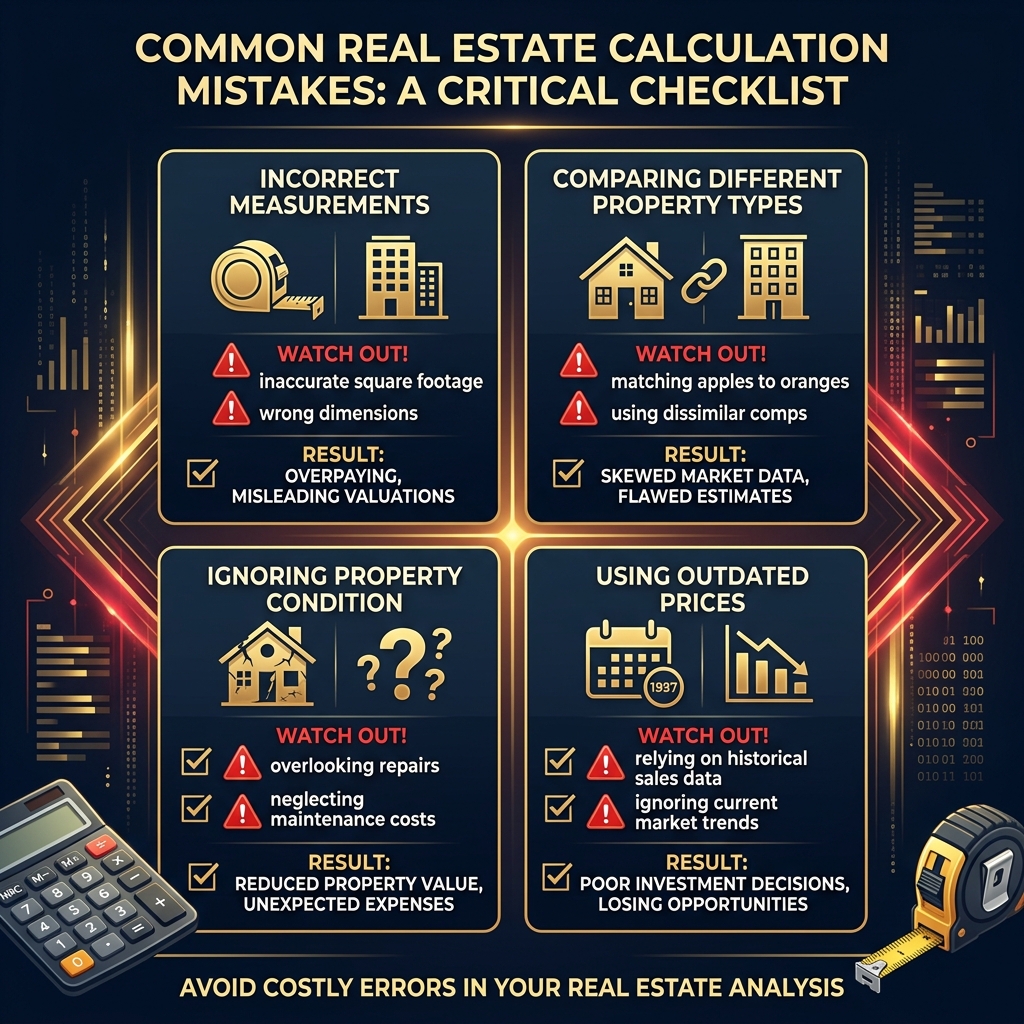
Ignoring Property Condition
Two homes with identical square footage in the same neighborhood can have dramatically different per-square-foot values if one has been fully renovated and the other has deferred maintenance. A newly remodeled kitchen adds $20,000 to $50,000 in value without adding a single square foot. Price per square foot captures the total picture, not just the space. Always account for condition when comparing.
Confusing Living Area with Total Area
A listing that says "3,000 total square feet" might include a 600 square foot unfinished basement and a 400 square foot garage. The actual living area is 2,000 square feet. Using 3,000 in your calculation produces $133 per square foot on a $400,000 home. Using the correct 2,000 produces $200 per square foot. That $67 per square foot difference makes the property look like a bargain when it is actually priced at market. Read the common square foot calculation mistakes guide for more pitfalls to avoid.
Using Outdated Property Prices
Property values shift with market conditions. A comparable sale from 18 months ago may not reflect today's market. In a rising market, using old comps undervalues the subject property. In a declining market, old comps overvalue it. Use sales from the past three to six months whenever possible. If your market moves quickly, limit comps to the past 90 days.
What Is Included in Square Footage?
Knowing exactly what counts toward square footage prevents the most expensive measurement errors in real estate. The ANSI Z765 standard governs residential square footage calculations across the United States.
Living Space
All finished, heated, above-grade rooms count. This includes bedrooms, living rooms, dining rooms, kitchens, bathrooms, hallways, closets, and laundry rooms. Walk-in closets count. Pantries count. Any room with finished walls, flooring, and climate control that sits above ground level is included.
Garage
Garages are excluded from square footage under ANSI Z765. Attached and detached garages, carports, and unfinished storage areas do not count. Even a finished, heated garage is excluded unless it has been formally converted with permits and a certificate of occupancy.
Basement
Finished basements are listed separately from the gross living area. They add value, typically at 50 to 75 percent of the above-grade per-square-foot rate, but they do not count toward GLA. Unfinished basements receive no credit in standard square footage calculations.
Balcony and Patio
Open balconies, patios, decks, and screened porches are excluded. Enclosed sunrooms may count if they are heated, have permanent walls, and connect to the interior of the home. The distinction depends on local standards and appraiser judgment.
Finished vs. Unfinished Areas
Finished space has drywall, flooring, heating, and cooling. Unfinished space has concrete floors, exposed framing, or no climate control. Only finished spaces above grade count toward the standard square footage that drives price per square foot calculations.
What Counts Toward Square Footage?
VisualHow to Interpret the Results
A price per square foot number means nothing without context. Interpreting the result requires comparing it against properties with similar characteristics in the same geographic area.
What Is Considered a High Price Per Square Foot?
A high price per square foot is one that exceeds the median for comparable properties in the same area by 10 percent or more. In a neighborhood where similar homes average $200 per square foot, anything above $220 requires justification. Premium finishes, better lot positioning, recent renovations, or unique architectural features can justify a higher per-square-foot price. Without those factors, a high number often signals overpricing.
What Is Considered a Low Price Per Square Foot?
A price per square foot 10 percent or more below the neighborhood median could signal a good deal or a hidden problem. Foreclosures, estate sales, properties needing major repairs, or homes with adverse features (near highways, train tracks, or commercial zones) often sell at a discount. A low per-square-foot price that reflects deferred maintenance is not a bargain if the repair costs exceed the discount.
Compare Similar Properties Only
Always compare within the same property type, neighborhood, and general condition level. A 1,200 square foot renovated bungalow and a 3,500 square foot dated colonial in the same zip code will have very different per-square-foot prices, and that difference is expected. Meaningful comparison requires matching like with like.
When Price Per Square Foot Can Be Misleading
Price per square foot is a useful starting point but never the complete picture. Several factors can make the metric misleading if you rely on it exclusively.
Location Differences
A 2,000 square foot home in San Francisco costs more per square foot than the same size home in rural Kentucky. Comparing across markets is not meaningful. Even within the same city, a home two blocks from a desirable school district can command 20 percent more per square foot than an identical home just outside the boundary.
Property Features
A home with a gourmet kitchen, hardwood floors, and a finished basement costs more per square foot than a comparable home with builder-grade finishes and an unfinished basement. The square footage is the same, but the value is not. Features add value without adding area.
Lot Size Differences
Price per square foot measures the building, not the land it sits on. A 1,800 square foot home on a quarter-acre lot and the same home on a full acre will have different total prices but similar per-square-foot rates for the structure. The lot contributes significant value that this metric ignores entirely.
Property Age and Condition
A brand-new 2,000 square foot home and a 40-year-old 2,000 square foot home with the original roof, HVAC, and plumbing are not equivalent despite identical square footage. The newer home costs more per square foot because it carries lower risk and lower near-term maintenance costs. Always factor age and condition into your analysis.
Price Per Square Foot vs. Cost Per Square Foot
These two terms sound identical but measure fundamentally different things. Confusing them leads to pricing errors that can cost thousands.
Key Differences
Price vs. Cost Per Square Foot
VisualPrice per square foot reflects what the market pays for a property. Cost per square foot reflects what it takes to build or improve a property. A home might cost $150 per square foot to build but sell for $250 per square foot in a strong market. The $100 difference represents land value, location premium, and market demand. Conversely, in a weak market, a home might cost $200 per square foot to build but only sell for $175, leaving the builder at a loss.
When to Use Each Metric
Use price per square foot when buying, selling, or appraising existing properties. Use cost per square foot when budgeting for new construction, renovations, or tenant improvements. If you are evaluating a new build, calculate both to understand the potential profit margin or loss.
Manual Calculation vs. Using a Price Per Square Foot Calculator
Benefits of Manual Calculation
Doing the math by hand forces you to verify each input. You confirm the price source, check the square footage measurement, and catch inconsistencies that automated tools miss. Manual calculation builds understanding of the relationship between price, area, and value. For single-property evaluations, it takes under 30 seconds and requires only basic division.
Benefits of Using a Calculator
When comparing five or more properties, a calculator saves time and eliminates arithmetic errors. The price per square foot calculator on this site handles multiple properties, adjusts for different units, and includes markup and tax fields for project-level cost estimation. For quick comparisons during open houses or property tours, a calculator gives you instant results on any device.
Tips for Getting Accurate Price Per Square Foot Calculations
Verify the Property Size
Never rely on a single source for square footage. Cross-check the MLS listing against county tax records and, when possible, the most recent appraisal. If the numbers differ by more than 3 percent, request a professional measurement before making pricing decisions.
Use Recent Market Prices
Limit comparable sales to the past three to six months. In fast-moving markets, use the past 90 days. Older comparables do not reflect current buyer behavior, interest rate impacts, or inventory levels. A comparable sale from 12 months ago may be 5 to 10 percent above or below today's values.
Compare Similar Properties
Match properties by type, size range (within 20 percent), age (within 10 years), condition, and location (within a half-mile radius). The more similar the comparables, the more reliable the average price per square foot becomes as a benchmark.
Double-Check Your Numbers
A misplaced decimal or a transposed digit changes the result dramatically. Entering 20,000 square feet instead of 2,000 produces a result that is off by a factor of ten. Verify every input before relying on the output. Run the calculation twice or use a calculator to confirm your manual work.
Frequently Asked Questions
Divide the total property price by the total square footage. A $300,000 home with 1,500 square feet equals $200 per square foot. This works for residential homes, commercial buildings, rental properties, and vacant land.
Price Per Square Foot = Total Property Price divided by Total Square Footage. A $450,000 property with 2,250 square feet gives you $200 per square foot. Always use the same measurement standard for every property you compare.
Add the price per square foot for each property, then divide by the number of properties. Three homes at $180, $200, and $220 per square foot average out to $200 per square foot. Use at least five comparable properties for a reliable average.
Divide the annual lease rate or purchase price by the total rentable square footage. A 3,000 square foot office space leased at $90,000 per year equals $30 per square foot per year. Commercial properties use rentable area, which includes a load factor for common spaces.
Divide the monthly rent by the total square footage. A 1,200 square foot apartment at $1,800 per month costs $1.50 per square foot per month. Multiply by 12 for the annual rate of $18 per square foot.
Divide the total land price by the lot size in square feet. A half-acre lot (21,780 square feet) at $150,000 equals $6.89 per square foot. Land prices vary dramatically based on location, zoning, and utility access.
Include all finished, heated living space with ceilings at least 7 feet high. Bedrooms, kitchens, bathrooms, hallways, and closets count. Exclude garages, unfinished basements, patios, and any space below grade.
Yes. Divide the price by the area in square meters. To convert, multiply price per square foot by 10.764 to get price per square meter. A property at $200 per square foot equals approximately $2,153 per square meter.
There is no universal standard. Rural areas range from $100 to $150 per square foot. Suburban areas range from $150 to $300. Urban centers can exceed $1,000 per square foot. Always compare against recent comparable sales in the same neighborhood.
No. Price per square foot reflects the market value or purchase price. Cost per square foot reflects construction or renovation expenses. A home may cost $150 per square foot to build but sell for $250 per square foot due to location and demand.
Conclusion
Price per square foot is the single most efficient metric for comparing real estate values across properties of different sizes. The formula is simple: total price divided by total square footage. But the quality of that result depends entirely on the accuracy of your inputs. Verified square footage, current market prices, and consistent measurement standards separate a useful calculation from a misleading one.
Always verify square footage against at least two independent sources before dividing.
Compare only similar properties in the same neighborhood, type, and condition range.
Use recent comparable sales from the past three to six months for reliable benchmarks.
Understand the difference between price per square foot (market value) and cost per square foot (construction expense).
Account for condition, features, and lot size, because square footage alone never tells the full story.
That Austin buyer I mentioned at the start? After running the price per square foot calculation and comparing it against eight recent sales, they negotiated the price down by $52,000 and closed at $205 per square foot, right in line with the neighborhood median. One simple formula saved them more than most people earn in a year. Whether you are buying your first home, evaluating a commercial lease, or pricing rental units, the price per square foot calculator gives you the number you need in seconds. Start with the right measurement, apply the formula, and let the math guide your decision.